Figure 3.
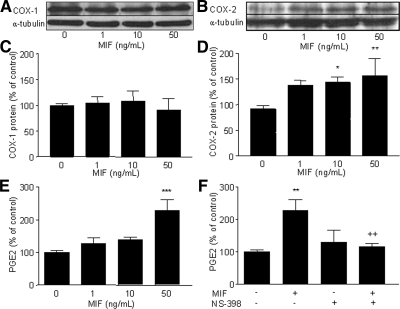
Western blot analysis of COX-1 and COX-2 expression in human endometriotic cells and detection of PGE2 secretion in response to MIF. After starving, cells were incubated 24 h with 0, 1, 10, or 50 ng/ml MIF. Protein extraction and Western blotting were performed as described in Materials and Methods. Western blotting of α-tubulin was performed on the same membranes to normalize COX protein expression. PGE2 concentration was measured by EIA. Representative Western blots of COX-1 (A) and COX-2 (B) are from patient nos. 3 and 1, respectively (Table 1). Densitometric analysis data are from three different endometriotic cell cultures for COX-1 (patient nos. 1, 3, and 4, Table 1) and from four different endometriotic cell cultures for COX-2 (patients 1, 3, 4, and 5, Table 1). COX-1 protein level did not vary significantly in endometriotic cells stimulated with MIF (C), whereas COX-2 protein level was increased in endometriotic cells in response to MIF (D). MIF significantly induced PGE2 secretion by endometriotic cells (E), and such an effect was inhibited by NS-398 (50 μmol/liter), a specific inhibitor of COX-2 activity (F); data are from four different endometriotic cell cultures (patient nos. 2–5, Table 1). *, P < 0.05; **, P < 0.01; and ***, P < 0.001 are significantly different from the control medium, which was devoid of stimuli (0 ng/ml MIF). ++, P < 0.01 is significantly different from cells incubated with the same concentration of MIF (50 ng/ml), using ANOVA and the Bonferroni’s multiple comparison test post hoc.

