
Figure 3.
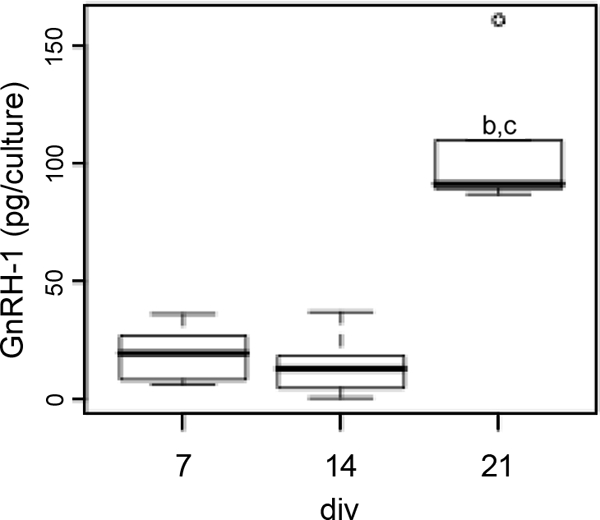
GnRH-1 content as a function of the age in culture. Tukey’s box plot [box lower limit, lower quartile Q1; box upper limit, upper quartile Q; black line, median Q2; whisker, 1.5 × interquartile range (IQR); circles, extreme observation] of GnRH-1 contents. GnRH-1 content was significantly higher at 21 div (one-way ANOVA, P < 0.050). Post hoc pair-wise comparison using the Bonferroni method (P < 0.05). b, significantly different from 7 div; c, significantly different from 14 div.