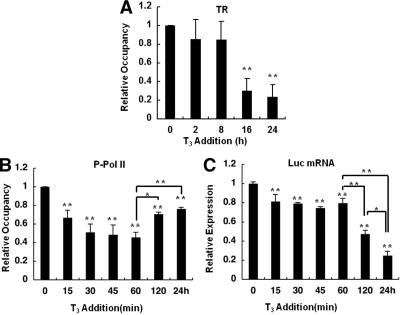
Figure 3.
Profiles of TRs and transcriptional activity of the TRH gene after a long incubation with T3. ChIP assays were performed with cells expressing the WT TR using antibodies against TRβ and Pol II phosphorylated at serine-5 (P-Pol II). A, ChIP assays showed that prolonged treatment with 100 nm T3 caused a significant reduction in the amount of TR on the TRH promoter. B, The amount of P-Pol II on the TRH promoter was reduced at 15 and 60 min after the addition of T3 but had gradually recovered by 120 min and 24 h. Each level was compared with the basal level (0 min). C, Real-time PCR for Luc mRNA was performed using GH4C1 cells stably expressing the TRH promoter reporter gene and the WT TR. Addition of 100 nm T3 decreased Luc mRNA expression at 15 min, and that level was maintained until 60 min. A further reduction was observed at 120 min and at 24 h. Each level was compared with the basal level (0 min). The data are presented as the mean ± se for three independent experiments. Asterisks indicate a significant difference vs. 0 min: *, P < 0.05; **, P < 0.01.

