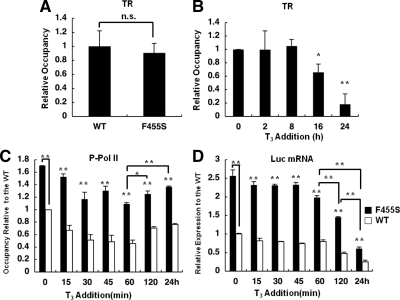
Figure 5.
Profile of TRs and transcriptional activity of the TRH promoter in the presence of F455S TR. ChIP assays were performed with cells expressing the WT TR or F455S mutant TR using antibodies against TR. A, The total amount of TR in GH4C1 cells expressing F455S in the absence of T3 was similar to that in the cells expressing WT TR. B, Prolonged treatment with 100 nm T3 caused a significant reduction in the amount of TR on the TRH promoter in cells expressing the F455S mutant. C, In the absence of T3, approximately 170% of the control level of Pol II phosphorylated at serine-5 (P-Pol II) was recruited to the TRH promoter in F455S cells (black bars). After the addition of T3, the level of P-Pol II remained high. The value is expressed relative to that of WT cells, and the level for WT cells at 0 min was set as 1.0. The white bars indicate the data for WT cells. D, Luc mRNA was measured in WT cells (white bars) or F455S TR cells (black bars). Approximately 250% of the Luc mRNA level in WT cells was expressed in F455S TR cells in the absence of T3. After the addition of T3, the level of mRNA remained high. The value is expressed relative to that of WT cells, and the level of WT cells at 0 min was set as 1.0. The data are presented as the mean ± se for at least three independent experiments. Asterisks indicate a significant difference vs. 0 min: *, P < 0.05; **, P < 0.01. n.s., Not significant.

