Figure 5.
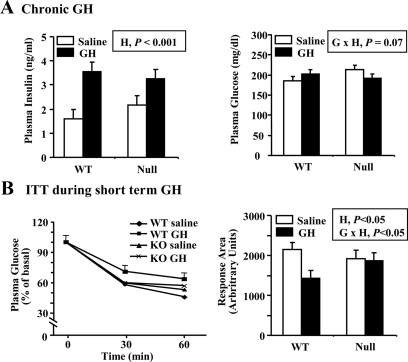
Effect of GH treatment on indices of carbohydrate metabolism. A, WT and null ALS mice (null) were treated twice daily with GH (3 μg/g body weight per injection) or an equivalent volume of saline from 35 to 63 d of age. Plasma levels of insulin and glucose were measured at the end of the treatment period. Each bar represents the mean ± se of 14–18 male and female mice. B, Eight-week-old WT and null mice were treated twice daily with GH (3 μg/g body weight per injection) or an equivalent volume of saline for 3.5 d. Plasma glucose was measured immediately before (0 min) and after (30 and 60 min) the administration of insulin (0.6 μU/g body weight). Relative plasma glucose levels are shown on the left with pooled se shown only for WT saline group for clarity. The graph depicting areas under the glucose response curve is shown on the right. The significant effects of G (WT or null), H (saline or GH), and their interaction (G × H) are reported. Each bar represents the mean ± se of nine to 10 male mice.

