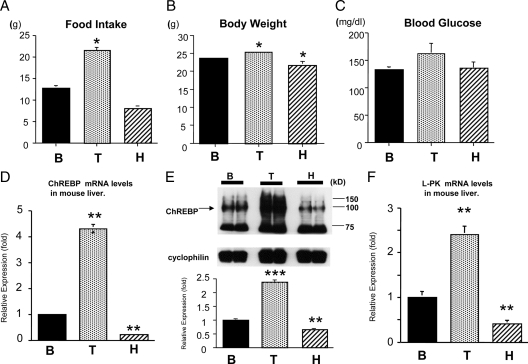
Figure 1.
The amount of food intake, body weight, and blood glucose levels in mice in different thyroid status (panels A–C). TH induced ChREBP mRNA and protein expression in the mouse liver (D–F). C57/B6 mice (4 wk old male) were first rendered hypothyroid (H) with MMI and PTU diet and then were treated with T3 (T). B was control. Each treatment involved six mice. *, Difference compared with B is significant at a confidence level of P < 0.05 by t testing. Panels D and F, Liver total RNA was isolated, and 1 μg of total RNA was subjected to RT. Real-time RT-PCR analysis for ChREBP (panel D) or L-PK (panel F) was performed using mouse liver cDNA. Relative values (mean ± se, n = 6) normalized by GAPDH mRNA levels compared with B are shown as relative expression (fold). **, Difference compared with B is significant at a confidence level of P < 0.001 by t testing. Panel E, Western blot analysis using mouse liver whole-cell extract. Representative Western blots for ChREBP are shown. Relative ODs (mean ± se, n = 6) normalized by cyclophilin levels compared with B are shown as relative expression (fold). **, Difference compared with B is significant at a confidence level of P < 0.001; ***, P < 0.0001 by t testing.

