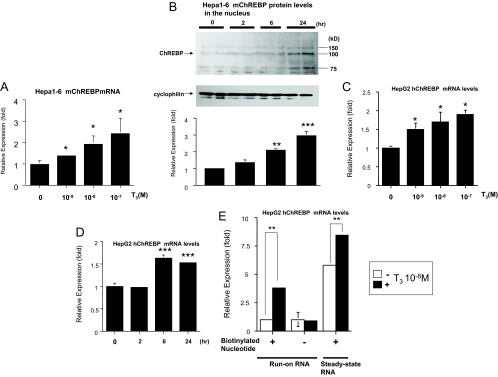
Figure 2.
T3 up-regulated ChREBP gene and protein expression at the transcriptional level. A, Hepa1-6 cells were cultured in 10-cm-diameter dishes and T3 was added to the medium as indicated. Real-time RT-PCR analysis was performed using Hepa1-6 cDNA. Results (mean ± se, n = 3) are normalized by GAPDH mRNA levels and showed as fold expression correlated to the level in the absence of T3, which was set to 1. *, Difference compared with the level in the absence of T3 is significant at a confidence level of P < 0.01 by t testing. B, Western blot analysis using the nuclear protein in Hepa1-6 cells. Representative Western blots for ChREBP are shown. Relative OD (mean ± se, n = 6) normalized by cyclophilin levels compared with the level in the absence of T3 (10−8 m) are shown as relative expression (fold). **, Difference compared with the level in the absence of T3 (10−8 m) is significant at a confidence level of P < 0.001; ***, P < 0.0001 by t testing. C and D, HepG2 cells were cultured in 10-cm-diameter dishes and T3 was added to the medium as indicated D, T3 (10−8 m). Real-time RT-PCR analysis was performed using HepG2 cellular cDNA. Results (mean ± se, n = 3) are normalized by GAPDH mRNA levels and showed as fold expression correlated to the level in the absence of T3, which was set to 1. *, Difference compared with the level in the absence of T3 is significant at a confidence level of P < 0.01; *** P < 0.0001 by t testing. E, Nuclear run-on assays were performed on nuclei isolated from HepG2 cells after treatment with T3 (10−8 m) for 16 h. Results (mean ± se, n = 3) are normalized by GAPDH mRNA levels and shown as fold expression correlated to the level in the absence of T3 with biotinylated nucleotide, which was set to 1. P < 0.001 (**) by t testing.

