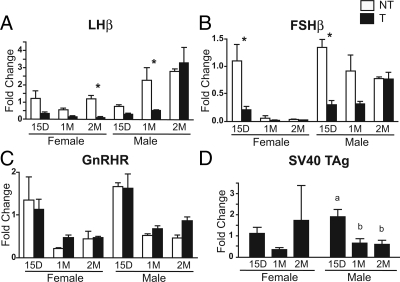
Figure 6.
Gonadotrope-specific and SV40 TAg gene expression in GnRHR-TAg transgenic and nontransgenic mice at 15 d (15D), 1 month (1M), and 2 months (2M) of age by QRT-PCR. Relative changes in pituitary LHβ (A), FSHβ (B), GnRHR (C), and SV40 TAg gene (D) expression in nontransgenic (NT) (white bars) and transgenic (T) (black bars) females and males. Fold change, comparative CT method was used for mRNA quantification with β-actin as a loading control and the mean of 15-d nontransgenic female for each gene as a reference value. Sample sizes, n = 4. A–C, Asterisks (*) indicate significant difference between genotypes (post hoc, P < 0.05; after significant ANOVA comparison within sex). D, Dissimilar letters indicate significant difference between ages (post hoc, P < 0.05, after significant ANOVA comparison within sex).

