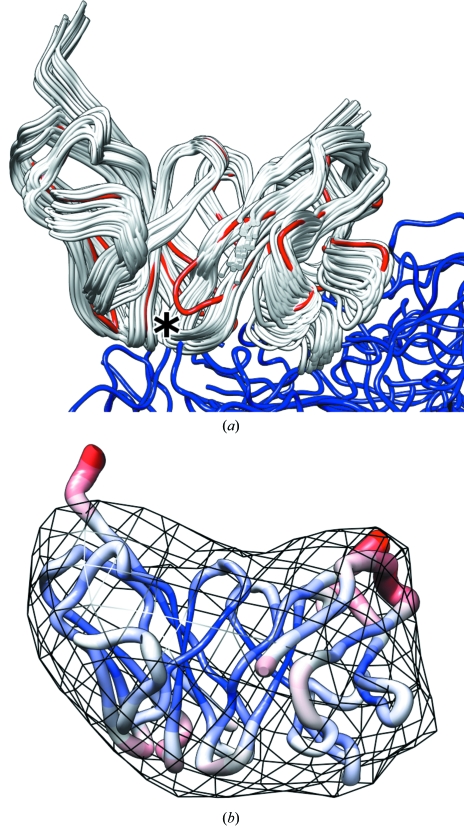
Figure 3.
Docking of Fab fragment into the equivalent density segment derived from an experimental electron-microscopy reconstruction. (a) The correct structure is shown in red (Fab fragment) and blue (virion). A representation of the ensemble of fitted structures with correlation coefficients within the confidence interval (solution set) is shown in white. The asterisk indicates the Fab-fragment loop that locally changes conformation upon binding to the virus. (b) Root-mean-square deviation within the solution set mapped onto the structure with thickness and color. Thinner and blue corresponds to small deviations and thicker and red to large deviations. The 28 Å resolution density map used for the docking experiment is shown as black chicken wire.

