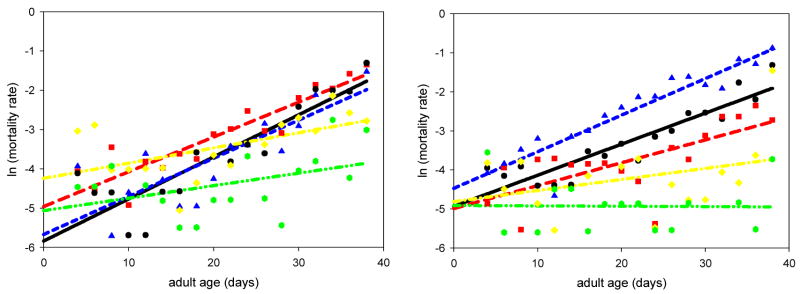
Fig. 3.
Results of experiment 2. The graph on the left depicts the mortality data for the males from experiment 2; all p-values are listed in Table 1. The virgin treatments had the most significant differences in their mortality rate and background mortality. The graph on the right depicts the mortality data for the females from experiment 2, and all p-values are also given in Table 1. Again, the virgin treatments had the most significant differences in their mortality rate and background mortality. Controls (●; line: black, solid); injured males with intact females ( ; line: red, long dash); intact males with injured females (
 ; line: blue, short dash); injured virgins (
 ; line: yellow, dash-dot); intact virgins (
 ; line: green, dash-dot-dot)

