
Fig. 4.
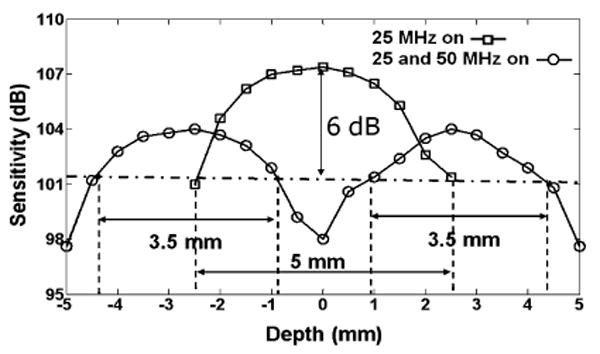
Measured system sensitivity, defined as the maximum attenuation producing a signal power equal to the noise power, for a configuration using one frequency shifter (squares, solid curve) and another using two frequency shifters (circles, solid curve).