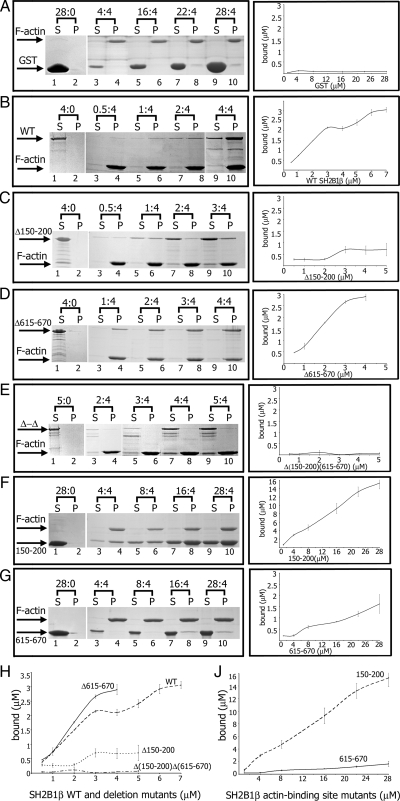
Figure 2.
SH2B1β binds F-actin. Before each experiment, WT SH2B1β and mutants were centrifuged in the absence of F-actin to remove any insoluble protein aggregates. A defined concentration of F-actin (4 μm) was mixed with increasing concentrations of the forms of SH2B1β or GST alone. Ratios above gel images indicate concentrations of recombinant proteins (in micromolar) to the constant concentration of F-actin (4 μm). After ultracentrifugation at 150,000 × g for 2 h, equivalent amounts of pellet (P) and supernatant (S) fraction were subjected to SDS-PAGE followed by Coomassie blue staining (A–G, left column). Protein bands were quantified using Bio-Rad Quantity One software. The amount of WT GST-SH2B1β or GST- SH2B1β mutants bound to F-actin was calculated from the known concentrations of proteins in the assay and the ratios of each protein in the supernatant and pellet. Plots of concentration (x-axis) vs. amount bound (y-axis) for WT SH2B1β and all mutants are shown in the right column. Plots of concentration (x-axis) vs. amount bound (y-axis) for WT SH2B1β and deletion mutants (H) and two actin-binding site mutants (J) are shown together. Bars represent mean ± se; n = 3.

