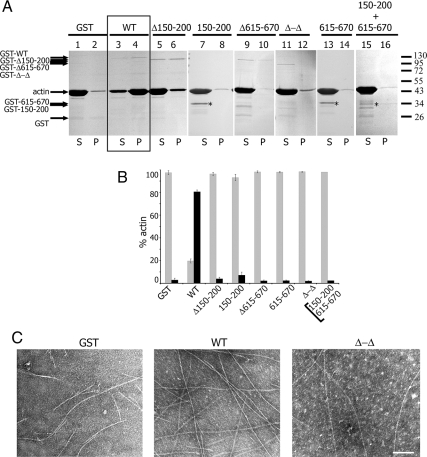
Figure 3.
SH2B1β cross-links actin filaments. For the low-speed centrifugation assay (A and B), 0.1 μm GST-SH2B1β WT or GST-SH2B1β mutants were incubated with 8 μm F-actin for 30 min in actin polymerizing buffer (F-buffer) and then sedimented at 16,000 × g for 1 h at 24 C. A, Equivalent amounts of pellet (P) and supernatant (S) fraction were subjected to SDS-PAGE, followed by Coomassie blue staining. Asterisks indicate the bands corresponding to the 150–200 and 615–670 mutants. B, Actin bands were quantified and plotted to indicate the percentage of actin bundled/cross-linked (pellet fraction, black bar) or not bundled/cross-linked (supernatant fraction, gray bar) for each GST-SH2B1β or GST-SH2B1β mutant. Bars represent mean ± se; n = 3. C, Electron micrographic images of negatively stained F-actin in the presence of GST (left), SH2B1β WT (middle), and Δ-Δ mutant (right). Scale bar, 100 nm.

