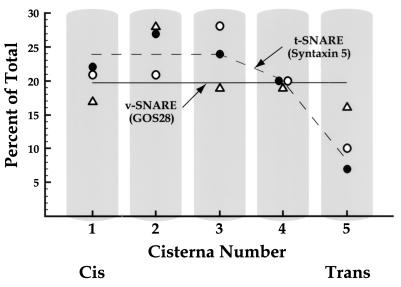
Figure 3.
Cis–trans distributions of GOS 28 (triangles) and Syntaxin 5 (open circles) across the Golgi stacks of CHO and HeLa cells, respectively. In each case, the percent of total gold particles over the Golgi stack located over a given cisterna is presented. The distribution of Syntaxin 5 in PC12 cells (closed circles) was established by Hay et al. (28) and is plotted according to their published data.

