
Figure 4.
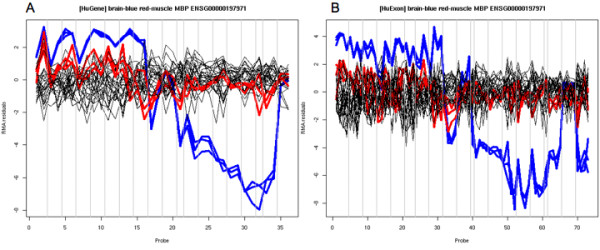
Normalized probe-level data and RMA residuals for MBP. Panels A and B show the residuals for Gene and Exon for RMA fits, respectively. There are 36 probes for Gene and 72 probes for Exon. Both panels show 33 lines, one for each hybridization (11 tissues with 3 biological replicates each). The brain and muscle replicates are shown blue and red lines, respectively.