Figure 1.
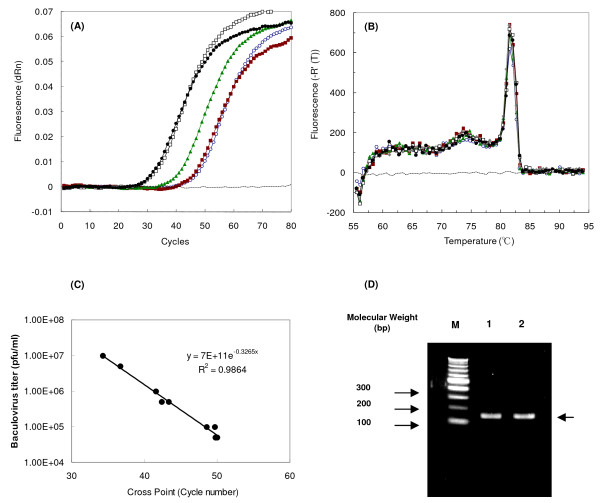
Q-PCR analysis of BmNPV-CP--/bx-GGT2. (A) The graph of fluorescent signals during Q-PCR cycles using various baculovirus stocks. (B) Melting curve analysis of Q-PCR products. Symbols in A and B: dotted lines, water; open circles, 4.9 × 10⁴ pfu/ml; closed squares, 9.8 × 10⁴ pfu/ml: closed triangles, 4.9 × 10⁵ pfu/ml; closed circles, 4.9 × 10⁵ pfu/ml; open squares, 9 × 10⁵ pfu/ml. (C) Standard calibration curve of cross point vs. log (BmNPV-CP-/bx-GGT2 titer). (D) Analysis of Q-PCR products using BmNPV-CP-/bx-GGT2 stock solution by 2% agarose gel. Lane M: 100-bp ladder DNA marker, lane 1: stock solution of 9.80 × 10⁵ pfu/ml, lane 2: stock solution of 9.80 × 10⁶ pfu/ml.

