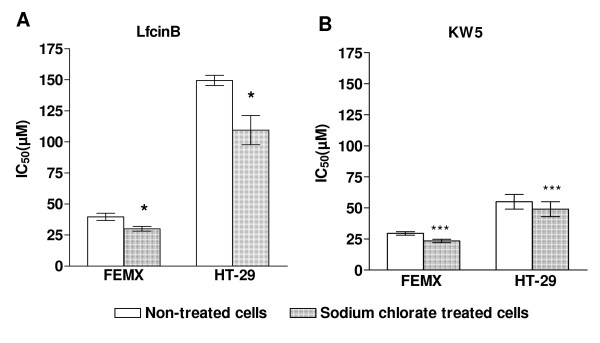
Figure 2.
The cytotoxic effect of LfcinB and KW5 against sodium chlorate treated and non-treated FEMX and HT-29 cells. The results are shown as the mean IC50 value ± SEM of LfcinB (A) and KW5 (B) against sodium chlorate treated (dotted bars) and non-treated (open bars) Femx and HT-29 cells. The experiment was repeated four times in duplicate. Statistics were performed by a paired t-test (GraphPad). P values are shown as follows: * P < 0.05 and *** P < 0.001.

