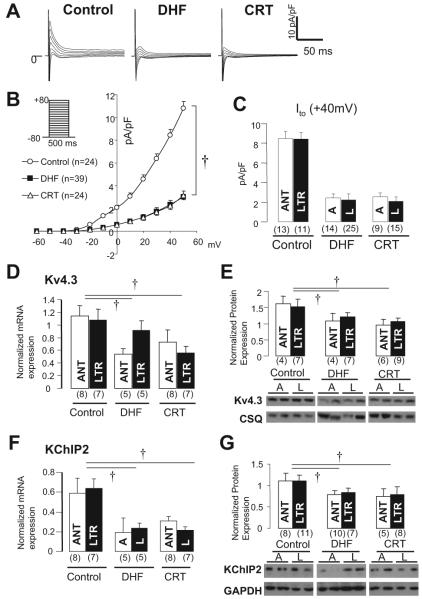
Figure 3.
Ito, and its underlying subunit mRNA and protein expression in control, DHF, and CRT. A, Representative current traces in lateral myocytes from control, DHF, and CRT ventricles elicited by the voltage-clamp protocol shown in inset. B, Peak current-voltage relationship of Ito in each group. C, Ito density at +40 mV in anterior and lateral myocytes of each group. D through G, Kv4.3 and KChIP2 mRNA and protein expression in LV midmyocardial tissue isolated from control, DHF, and CRT dogs. A or ANT indicates anterior; L or LTR, lateral; and CSQ, calsequestrin. †P<0.05 vs control.

