Figure 5.
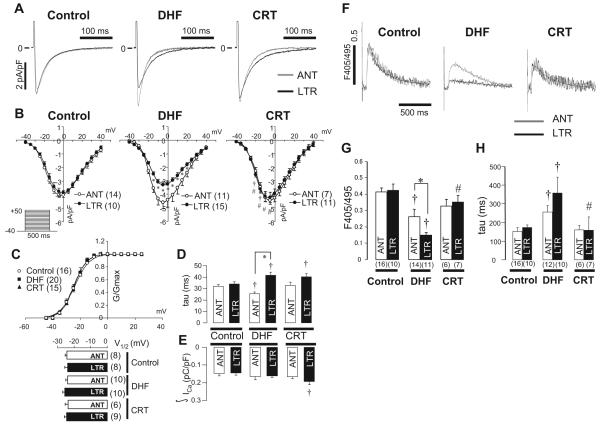
ICa and CaT in control, DHF, and CRT dogs. A, Representative ICa recorded from anterior and lateral myocytes. B, Peak current-voltage relationships for ICa,L in control, DHF, and CRT myocytes. Voltage-clamp protocol is shown in the inset. C, Voltage dependence of ICa activation in control, DHF, and CRT myocytes was fit with a Boltzmann equation of the form G/Gmax=1/[1+exp(V1/2-V)/k]. The voltage at which GCa was half-maximal (V1/2) did not differ among the 3 groups and regions. D, Plot of the time constant of the fast (major) component of current decay measured at 0 mV. E, Plot of the charge carried by ICa during the first 200 ms of the voltage step. F, Representative superimposed CaTs recorded in anterior and lateral myocytes from control, DHF, and CRT dogs stimulated at 0.5 Hz as measured with indo-1 fluorescence. G and H, Average peak fluorescence values and average decay τ of CaT measured at 0.5-Hz stimulation frequency in anterior and lateral myocytes from control, DHF, and CRT dogs. ANT indicates anterior; LTR, lateral. †P<0.05 vs control; #P<0.05 vs DHF by ANOVA; *P<0.05 by t test, anterior vs lateral.

