
Figure 8.
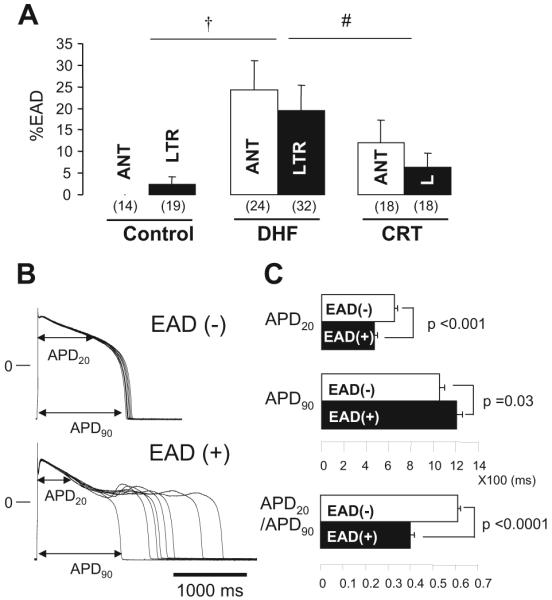
EADs in myocytes from control, DHF, and CRT hearts. A, Bar plot of frequency of EADs (%EADs indicates fraction of APs with EADs). B, Representative superimposed APs recorded in myocytes isolated from lateral wall of DHF hearts with [EAD(+)] or without [EAD(-)] EADs. C, Bar plots of APD20, APD90, and ratio of APD20 to APD90 (APD20/APD90) in failing myocytes. All data were obtained during pacing at 0.25 Hz. †P<0.05 vs control; #P<0.05 vs DHF. ANT or A indicates anterior; LTR or L, lateral.