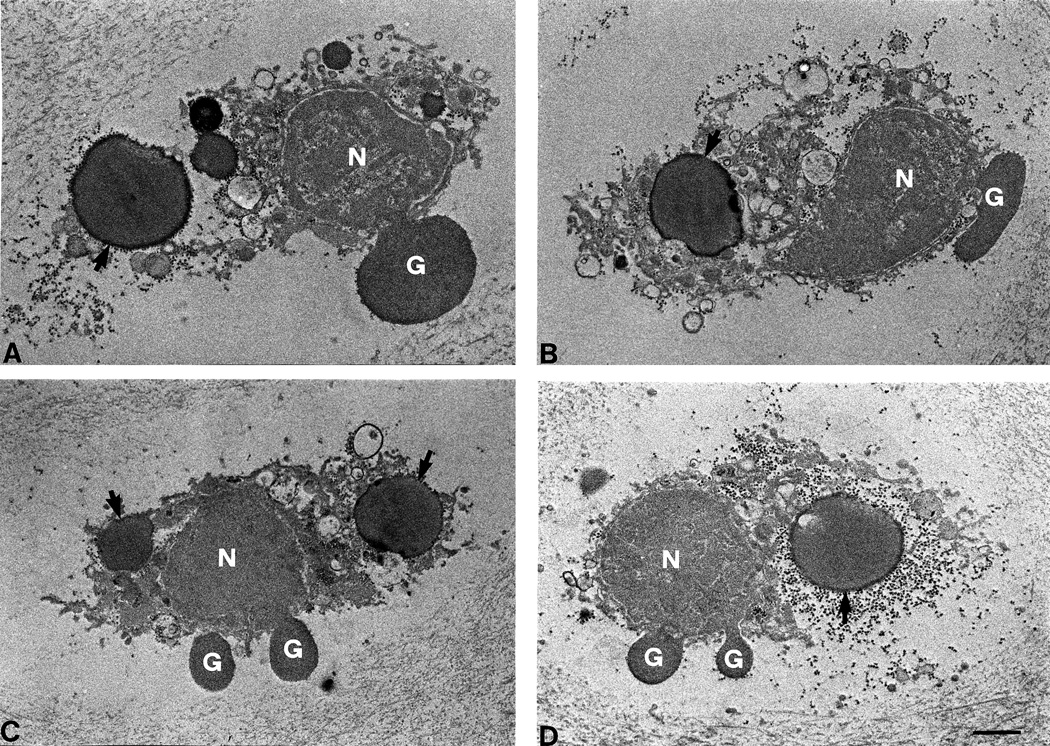
Figure 2.
Higher-resolution electron micrographs of apoptotic chondrocytes (A–D) undergoing nuclear blebbing (G) and containing apoptotic bodies (arrows). These two features were regularly encountered in apoptotic cells. Note that panel D is a higher-resolution image of the chondrocyte shown in Figure 1, panel I. N = nucleus; the scale bar represents 1 µm.

