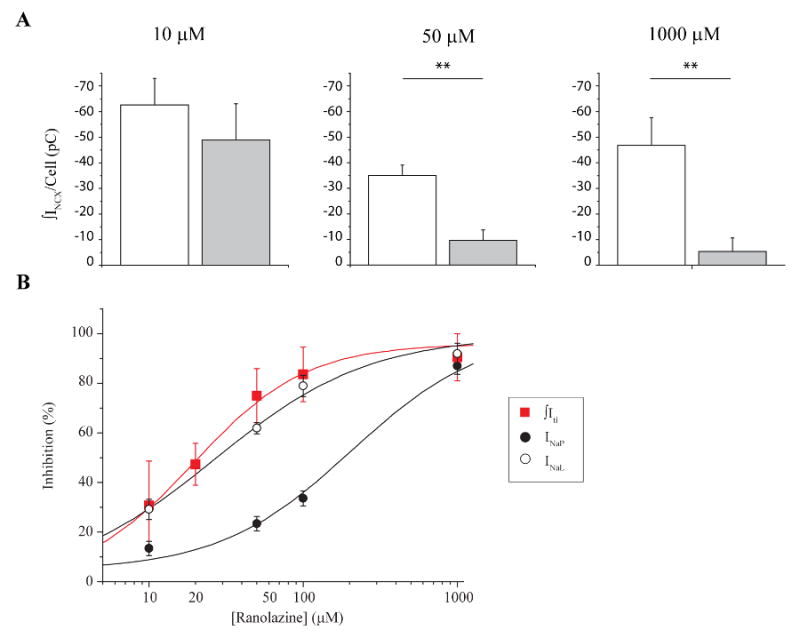
Figure 5. Ranolazine inhibition of ITI and INaL share similar concentration-dependence.

A. Bar graphs show mean ITI density per cell in control conditions (open) and after exposure to 10 μM (left; n = 5), 50 μM (middle; n = 8) and 1000 μM (right; n = 4) ranolazine (closed). **: p<0.05, paired. B. Summary plot of the concentration-dependence ranolazine inhibition of INa peak (●), INaL (○) and ITIs ( ). Smooth curves are best fits of concentration-response relationships to INaL, INaP and ITI data (see Methods).
