Fig. 3.
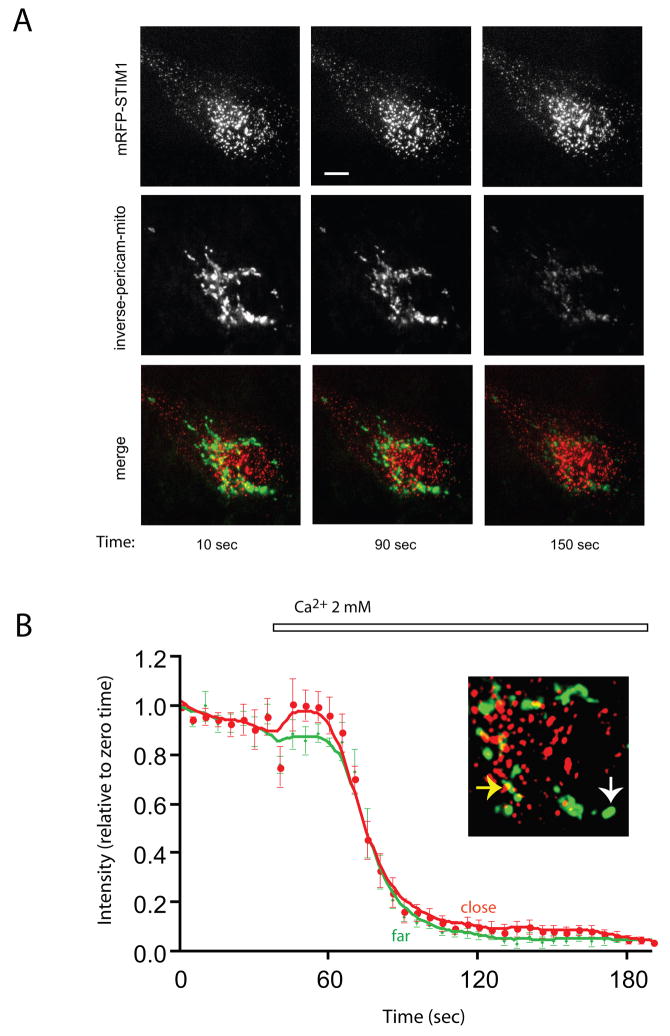
TIRF analysis (performed at room temperature) of COS-7 cells expressing mRFP-STIM1, untagged Orai1 and inverse-Pericam-targeted to the mitochondrial matrix. (A) This recording (representative for 5 cells) was started after treatment of cells with ATP + Tg in Ca2+ -free medium (~ 9 min). The punctate appearance of STIM1 (upper row) shows that STIM1 is already translocated to the peripheral parts of the ER. Mitochondrial fluorescence (middle row) is high at this point as Ca2+ influx cannot take place in the absence of external Ca2+ (left pictures). Ca2+ uptake was induced with the addition of 2 mM Ca2+, and mitochondrial Ca2+ uptake is indicated by the decreased fluorescence intensity of the mitochondrially targeted inverse Pericam (middle and right pictures of the middle row). The bar shows 10 μm (B) Quantitative analysis of fluorescence changes during the time-course of this recording. Red and green traces show changes in the i-Pericam fluorescence intensity in selected mitochondria close to (contacting) or far (more than 10 pixels distance) from mRFP-STIM1 fluorescence. The data points for each ROI were expressed as per cent of max-min values and these values were averaged (means ± S.E.M., n= 4). The enlarged image shows an example for a close (yellow arrow) or far (white arrow) mitochondrion relative to active STIM1 areas.

