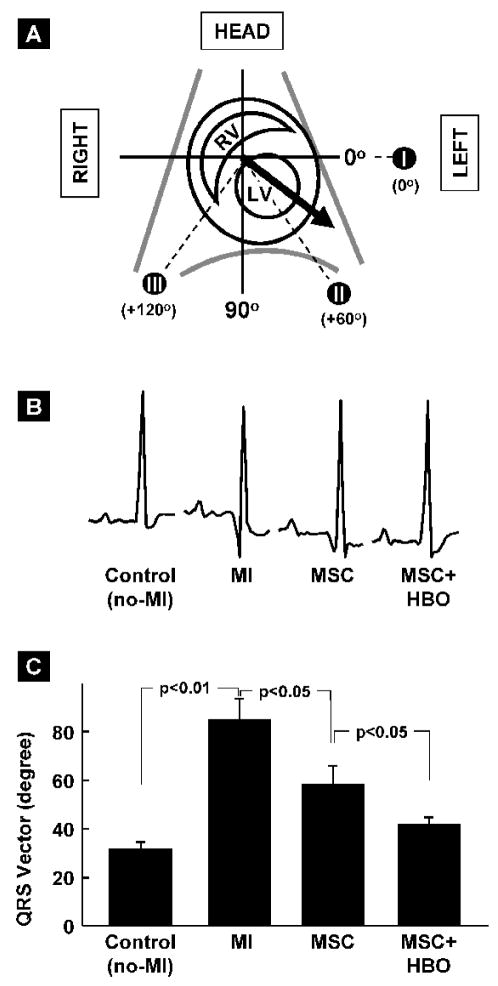
Figure 4. Ventricular depolarization as measured by vectorcardiography (VCG) in MI hearts treated with MSC and HBO.
Signal-averaged QRS vector (mean electrical axis) in the frontal plane of rat hearts was obtained from EKG data measured (see methods for a description) 2 weeks after MSC transplantation. (A) Schematic representation of the QRS vector (bold arrow) in the context of heart chambers and axial reference system (I, II & III). (B) Representative signal-averaged EKG tracings (Lead II) after MSC transplantation at 2 weeks. (C) Orientation of QRS vector in the hearts of treatment groups, as indicated. Data represent mean±SD obtained from 6 hearts. MI hearts show a very significant rightward deviation from Control hearts. MSC+HBO group shows significantly increased leftward shift (restoration) when compared to MSC group

