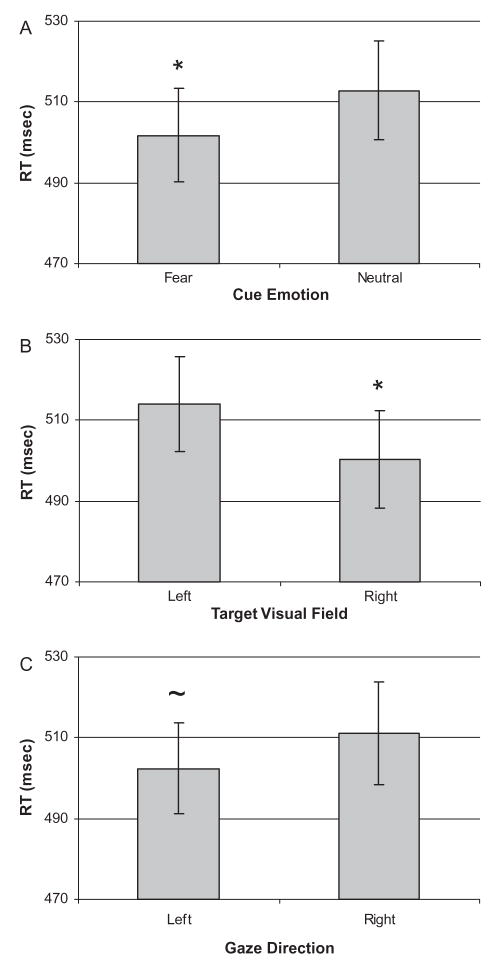
Figure 3.
Mean reaction time (RT) in ms for each main effect. (A) RT to targets preceded by fearful and neutral expressions. (B) RT to targets presented in the left and right visual fields. (C) RT to targets preceded by leftward and rightward gaze shifts (p=.069). Error bars represent the standard error of the mean. * p<.05, ~ p<.1.

