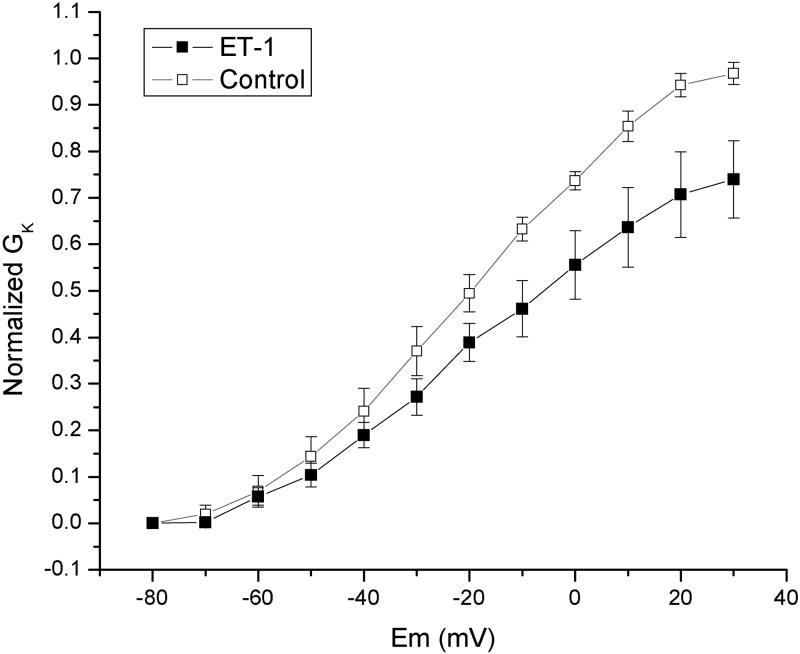
Figure 3.
Normalized K+ conductance vs test potential calculated from IK measured at the very end of a 200msec depolarization, in Control media and then at 7-10 min after exposure to 50nM ET-1. n=6 for each condition. Conductance was calculated using an Ohmic assumption and the G vs E data fit by a Boltzmann equation (see methods).

