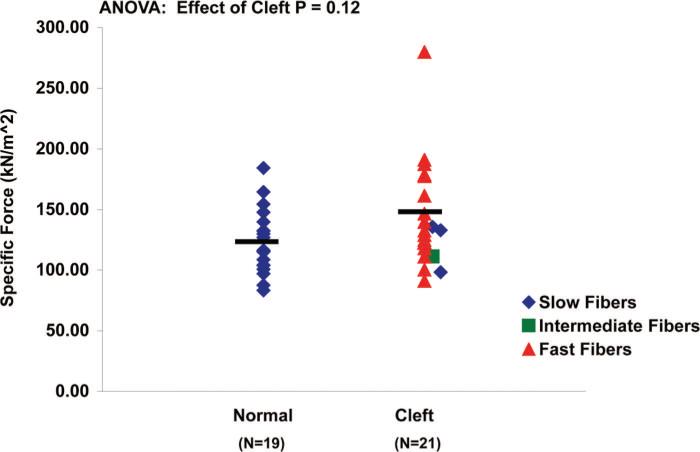
Fig. 5.
Specific force in normal and cleft palate muscle fibers. Muscle fibers from the cleft palate group did not generate more specific force (143 ± 9.34 kN/m2) than those from the normal palate group (123 ± 6.09 kN/m2)(p = 0.12). Each symbol represents one fiber and the bars denote the mean values.

