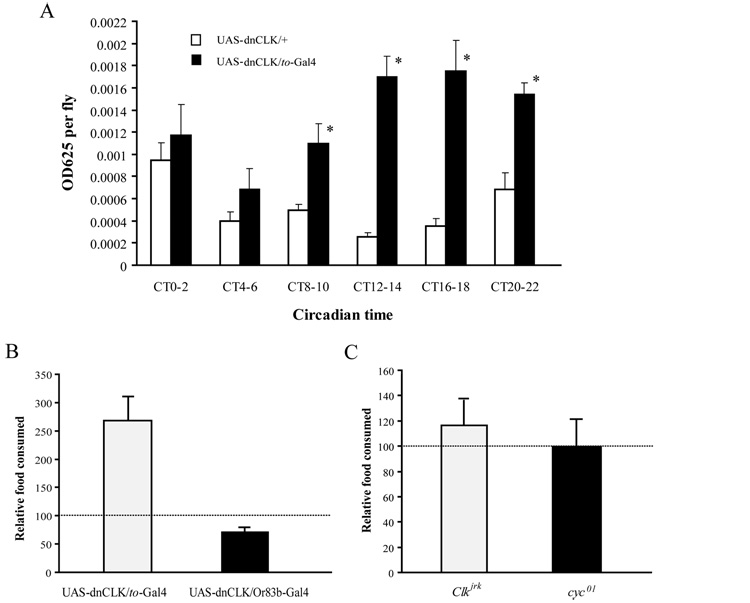
Figure 3. Clocks in metabolic tissues regulate overall food consumption.
(A) Flies in which the fat body clock is disrupted consume more food than control flies. Food consumed during 2 hour intervals at different times of day was determined as described in Figure 1. Asterisks indicate significant differences (p<0.05) in food consumption between flies carrying only UAS-dnCLK and flies carrying both UAS-dnCLK and to-Gal4, at the same time point. The data shown here are the same as in Figure 2B. However, they are plotted to show total rather than relative food consumption at every time point. Note that the increased food consumption of flies carrying both UAS-dnCLK and to-Gal4 is more striking during the nighttime. Statistical significance was determined by two-tailed Student’s t-test with unequal variance. (B) Effect of disrupting the clock in either fat body or in olfactory neurons on total food consumption. The total amount of food consumed in 24h was dramatically increased in flies carrying UAS-dnCLK and to-Gal4 and slightly decreased in flies carrying UAS-dnCLK and Or83b-Gal4, compared to flies carrying only UAS-dnCLK. Total food consumed in 24h was calculated by adding all the normalized OD625values measured during the six time periods. The horizontal line indicates total food consumption in flies carrying only UAS-dnCLK. Data for other lines were normalized to the value for the UAS-dnCLK line. (C) Total amount of food consumed in 24h was not different for Clkjrk or cyc01 flies compared to control ry506 flies. The dashed line indicates total food consumed by ry506 flies. Statistical significance was determined by two-tailed Student’s t-test with unequal variance. Asterisks indicate significant differences (p<0.05).

