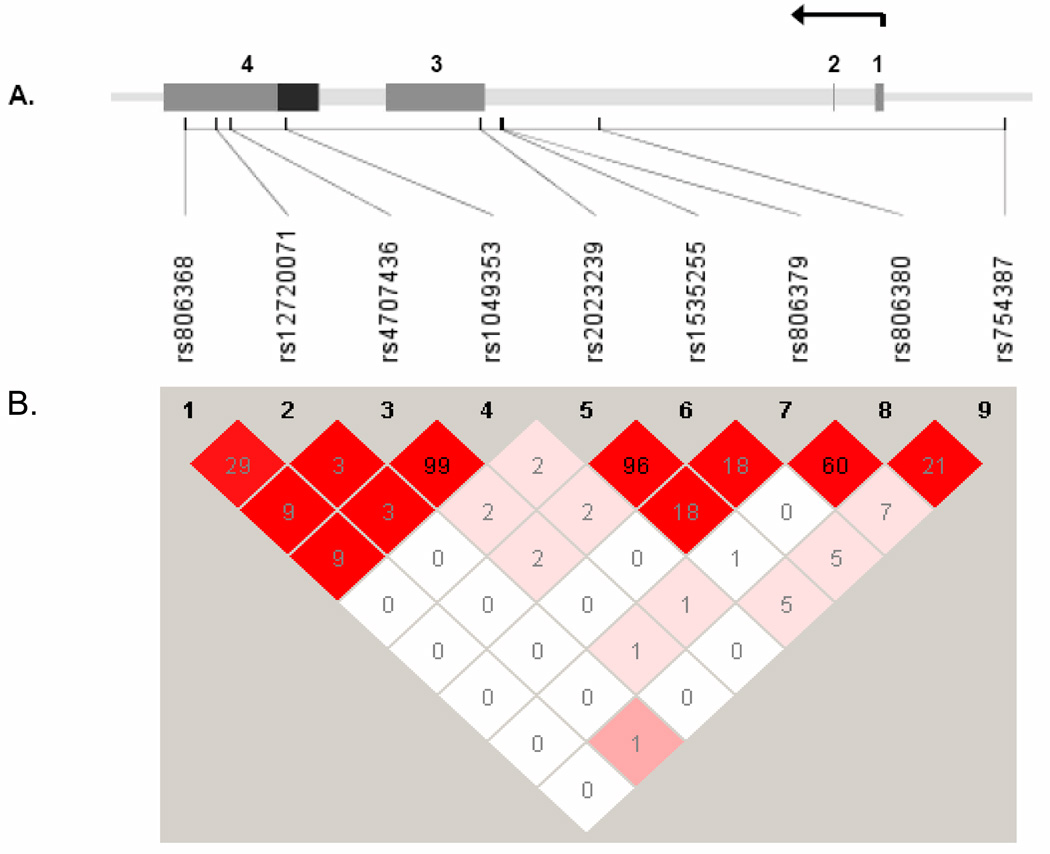
Figure 1.
A. The gene structure of CNR1 was based on the annotation of Zhang et al (Molecular Psychiatry, 2004; 9:916–931), and is shown across the top of the figure with SNPs positioned below. Exons are numerically labeled with coding region in black and the untranslated regions in grey. The arrow denotes direction of transcription. B. Pairwise linkage disequilibrium between the genotyped SNPs is numerically represented as r2. The color coding reflects D’ with red reflecting a D’=1. The arrow represents the direction of transcription.

