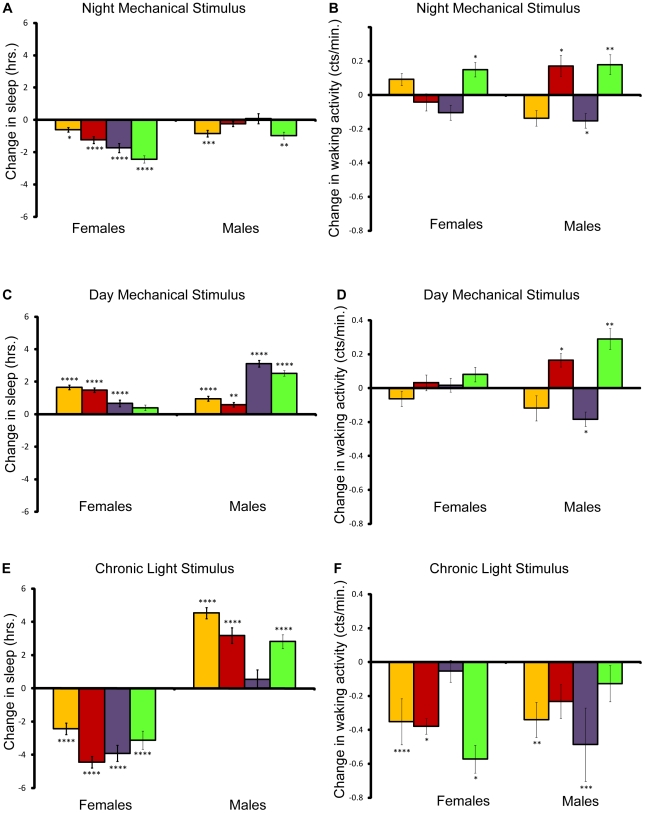
Figure 2. Effect of mechanical and light stimuli on sleep and waking activity.
Amounts shown relative to age/sex-matched control. P values reflect significance relative to controls for each line and sex. Yellow bars, w 1118; Canton-S; red bars, Canton-S; purple bars, Oregon, and green bars, 22-2. ****P<.0001; ***P<.001; **P<.01; *P<.05. Error bars represent the standard error of the mean. (A), Change in sleep per day for flies mechanically stimulated at night. (B), Change in waking activity per day for flies mechanically stimulated at night. (C), Change in sleep per day for flies mechanically stimulated during the day. (D), Change in waking activity per day for flies mechanically stimulated during the day. (E), Change in sleep per day for flies stimulated by light. (F), Change in waking activity per day for flies stimulated by light.

