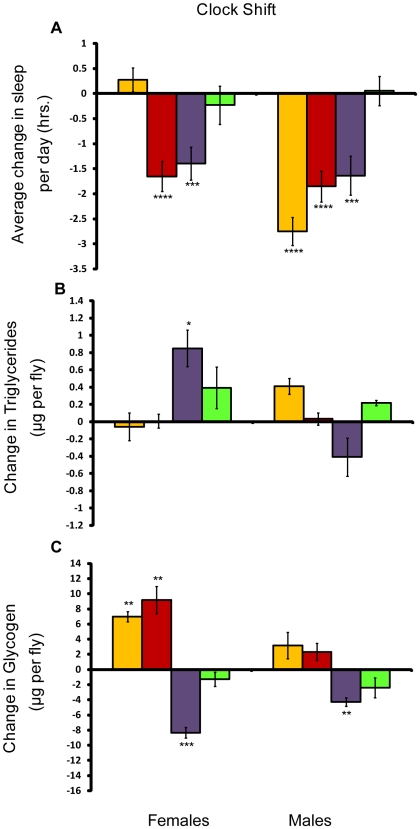
Figure 8. Effect of the clock shift on sleep, triglycerides, and glycogen.
Amounts shown relative to age/sex-matched control. P values reflect significance relative to controls for each line and sex. ****P<.0001; ***P<.001; **P<.01; *P<.05. Error bars represent the standard error of the mean. Yellow bars, w 1118; Canton-S; red bars, Canton-S; purple bars, Oregon, and green bars, 22-2. (A) Average change in sleep per day for shifted flies; (B) Change in whole-body triglycerides in μg per fly; (C) Change in whole-body glycogen in μg per fly.

