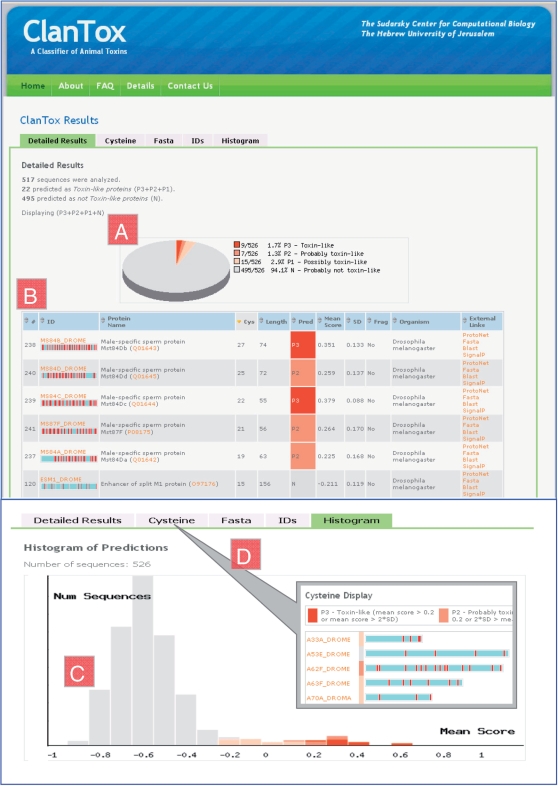
Figure 2.
Screenshots of the ClanTox result page. (A) A pie chart displaying the distribution of prediction classes for 526 short sequences (20–160 amino acids) retrieved from the Drosophila proteomes following filtration of all sequences that contain fragments. The positive predictions (P1–P3) constitute 5.9% of the sequences and are marked in shades of red (P3) to light pink (P1). (B) A detailed table of toxin-like proteins predictions sorted by the number of cysteines (Cys). Few examples labeled as P3 (red), P2 (light red) and N (gray) are shown. Together with the ID column, a graphical scheme is used to represent protein sequences (not to scale, light blue bar) marked by cysteine residue distribution (red vertical bars). In addition, the table shows the protein names, UniProtKB accession, the number of cysteines, sequence length, the mean score and standard deviation (SD). Several links to external tools are presented for each predicted protein. (C) Histogram of mean scores for the 526 Drosophila sequences that are used as input. The positive predictions are color coded as in A. Most sequences were predicted negative and are shown in gray. (D) A cysteine centric view, the sequences shown by their relative length. Cysteines are marked as red vertical lines.

