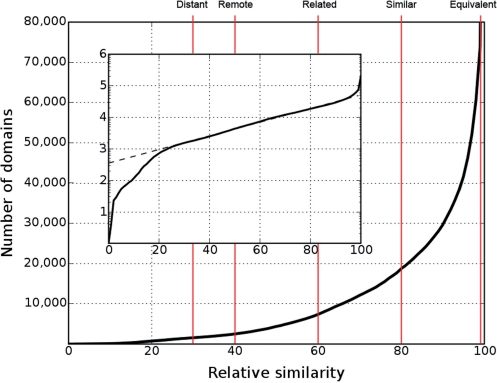
Figure 2.
Number of distinguishable folds (domains) as a function of relative similarity s. As shown in the insert, in the range 20 ≤ s ≤ 95 the logarithm (log10) of the number of distinguishable folds rises linearly as a function of relative similarity s. Hence, within this range the number of distinguishable folds, n, follows an exponential law n ≈ 10λs, where λ is the slope of log10 n in the linear range (9). Red lines denote the relative similarity cut-offs of the layers defined in COPS. The descriptive name of each layer is shown at the top end of the respective line. The names are chosen to relate the numerical definitions to their intuitive meaning (8). The layers may also be referred to by their short names (the character L+the relative similarity: L30, L40, L60, L80, L99).

