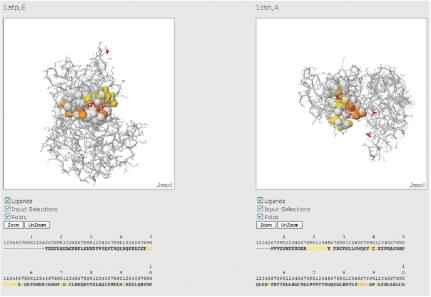
Figure 5.
Side-by-side view of 1atp, chain E and 1csn, chain A. The atoms that belong to the solution are colored following a gradient from the N-terminal (yellow) to the C-terminal (red). For each structure, the residues that belong to the solution are colored according to the colors in the Jmol visualization.

