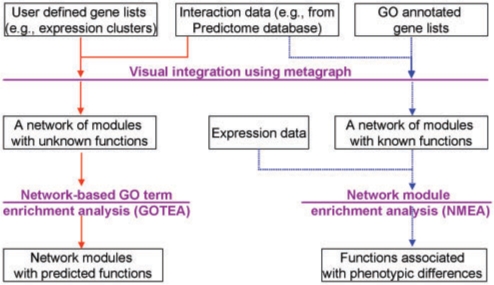
Figure 1.
Different roles of GO annotation in two different workflows designed for VisANT 3.5. The solid red lines represent the workflow of functional profiling where GO annotations are used to interpret the roles of a given gene set. The dashed blue lines represent the workflow of the gene set/network module enrichment analysis, where GO terms and associated genes are used to construct the functional modules.

