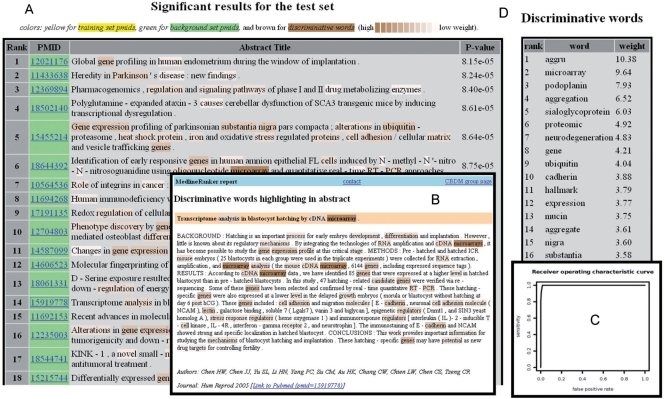
Figure 1.
The results page is composed of several sections. The table of significant abstracts (A), here related to microarray and protein aggregation, is sorted by ascending P-values and shows article titles and PubMed identifiers (PMIDs). Discriminative words are highlighted in titles or in abstracts, which are displayed in a popup window hyperlinked from their PMID (B). The performance of the ranking is shown using a table and the corresponding Receiver Operating Characteristic curve plotting the sensitivity versus the false positive rate (C). The last section contains the table of discriminative words (D), which is sorted by decreasing weights (the most important words at the top).

