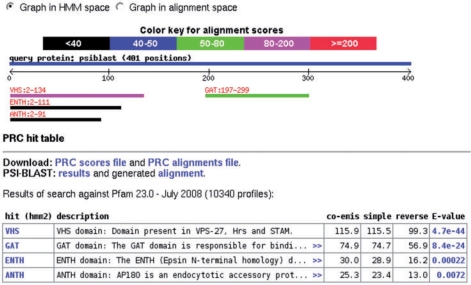
Figure 1.
An example of the webPRC domain graphic and hit table section for GGA1_HUMAN run against Pfam (after running PSI-BLAST). The graph can be viewed in HMM or alignment space and the hits are hyperlinked to the alignments. The PRC hit table provides links to the original PRC and PSI-BLAST output and shows a table with annotated hits, including the name and, after clicking on ‘>>’, the description from the domain database. The hits are hyperlinked to the source database and E-values are hyperlinked to the alignments. Co-emission, simple and reverse scores are calculated by PRC [cf. (12)]. The E-value is calculated from the reverse score.

