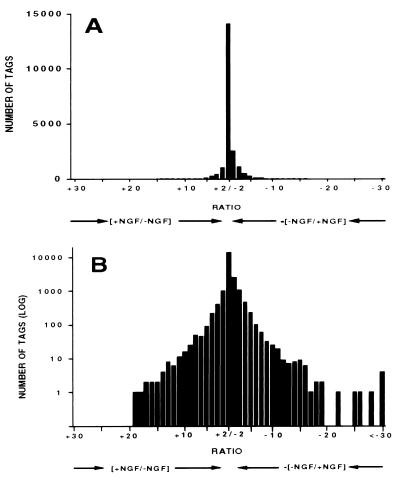
Figure 1.
Distribution of NGF-promoted changes in expression of transcripts in PC12 cells as revealed by SAGE. Transcripts for which two or more tags were detected are included. Up-regulated transcripts are to the left, down-regulated transcripts to the right. Tag numbers are expressed either on a linear (A) or log (B) scale.

