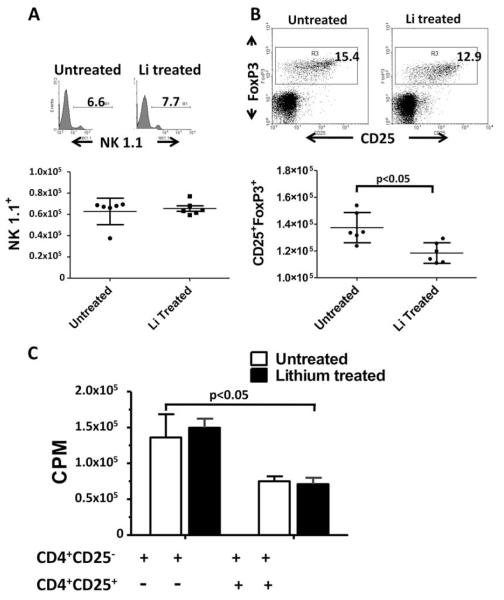
FIGURE 5.
Effects of lithium treatment of mice on NK cells and Treg cell. A, Lithium treatment did not alter the number of NK cells. The histogram depicts the percent of NK1.1 positive cells from each of lithium-untreated and treated mice. The scatter plot (lower panel) shows the number of NK1.1 cells per million spleen cells ± SD from lithium-untreated and treated mice (n = 5). B, Treg cells are reduced in spleens of lithium-treated mice. The dot plot shows the percentage of CD25+FoxP3+ T cells within a CD4+ gated population of cells from spleens of lithium-untreated and treated mice. The scatter plot shows the number of CD4-gated CD25+FoxP3+ T cells per million spleen cells from lithium-untreated and treated mice ± SD (n = 5). C, Lithium treatment did not alter Treg cell activity. Treg cells from lithium-treated and untreated mice were evaluated for their ability to suppress the anti-CD3-induced proliferation of CD4+CD25- responder T cells from C57BL/6 mice in a [3H]-thymidine incorporation assay. Data represent mean ± SEM (n = 3).

