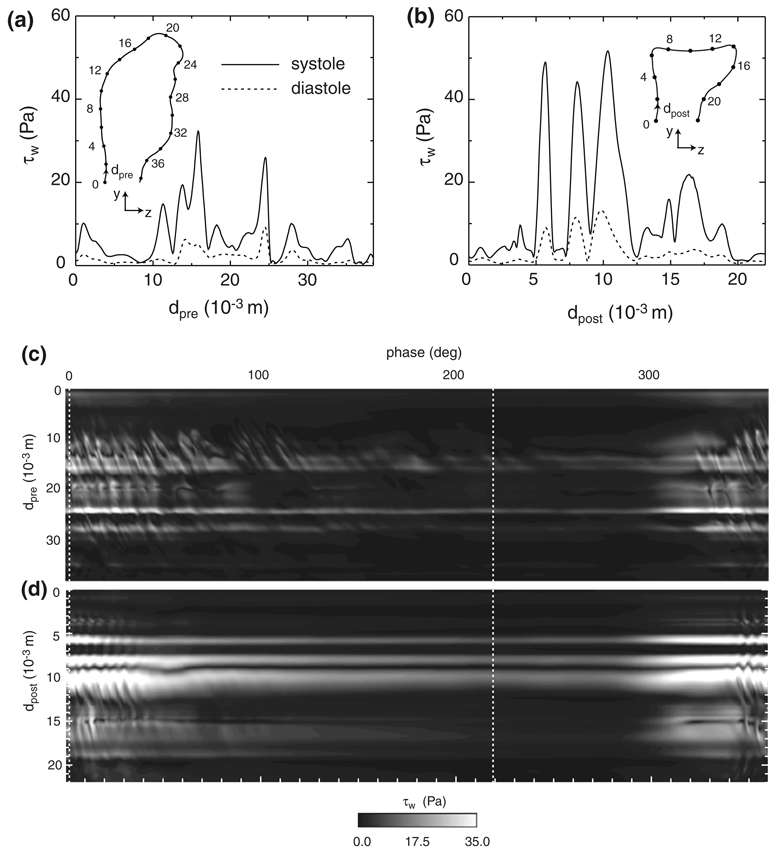
FIGURE 6.
WSS at x = 0 for the (a) pre- and (b) post-treatment bifurcations at systole (phase = 2°, solid line) and diastole (phase = 219°, dashed line). Spatial-temporal plot of the WSS at x = 0 for the (c) pre- and (d) post-treatment bifurcations over one cardiac cycle. The vertical dashed lines denote the phase locations of systole and diastole.

