
Figure 1. E2F1 expression is higher in BL than in LCL cell lines.
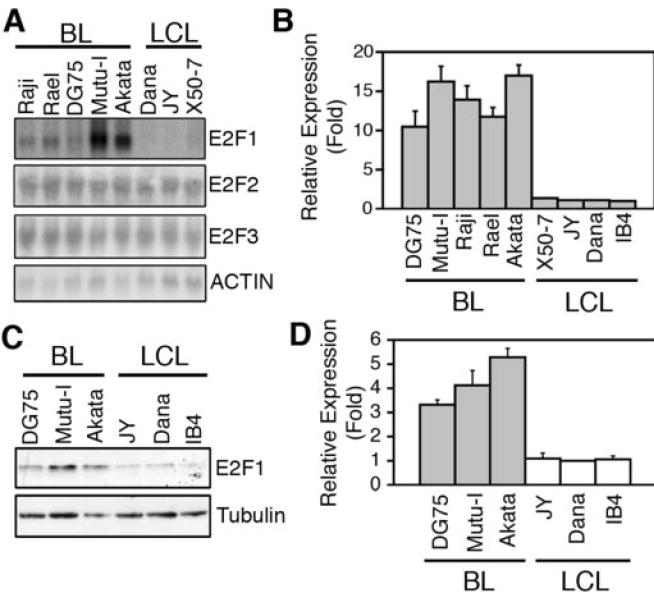
(A) Northern blot analysis of E2F1-E2F3, and ACTIN mRNA expression in the indicated cell lines. (B) qPCR analysis of E2F1 expression in the indicated cell lines. Expression is shown relative to that found in the LCL cell line Dana as the average ± SD (n=4). (C) A representative immunoblotting analysis of E2F1 and Tubulin protein expression in the indicated cell lines is shown. (D) The E2F1 signal was normalized by the Tubulin signal for each sample. The normalized expression of E2F1 (Average ± SD) in each cell line, relative to that in Dana, of four independent experiments is shown.