
Figure 3. E2F1 expression is down-regulated by specific shRNAs.
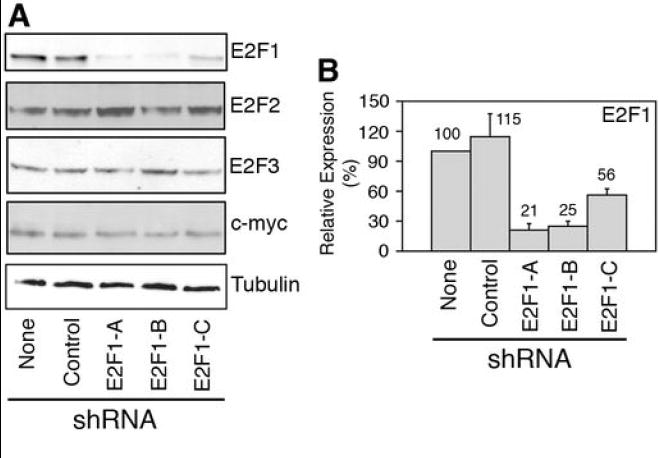
DG75 cells were transduced with lentiviruses bearing the indicated shRNAs. (A) Immunoblot staining of cell extracts with the indicated antibodies. (B) Average ± SD (n=4) of E2F1 expression normalized by the tubulin signal and relative to DG75 cells infected with the empty virus (None) is shown. Numbers above the columns indicate the average of E2F1 relative expression.