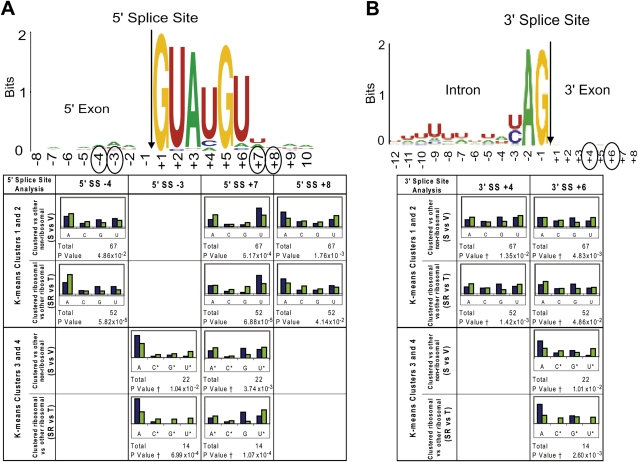
FIGURE 5.
Base prevalence found in accumulated pre-mRNA resulting from mutations in U5 loop 1. For reference, the base prevalence found near the 5′ splice site (A) and the 3′ splice site (B) for all intron-containing yeast pre-mRNAs is displayed at the top as sequence logos (Crooks et al. 2004). The occurrence of each base (A, C, G, or U) at each position in the RNA around the 5′ splice site and 3′ splice site was tabulated. A χ2 test was used to compare observed base composition (set S pre-mRNAs; blue bars) with the expected base composition (set V pre-mRNAs; green bars) in that region and P-values were calculated (see Materials and Methods). “*” Indicates bases that were binned and “†” indicates where Yates correction for continuity was applied due to the small number of bases. For comparison, the same analysis was performed on the selected (set RS) versus other (nonselected; set T) ribosomal protein pre-mRNAs, to determine whether any differences seen may be due to features common to all ribosomal protein transcripts. Results are presented for positions where both P-values were less than 0.05.

