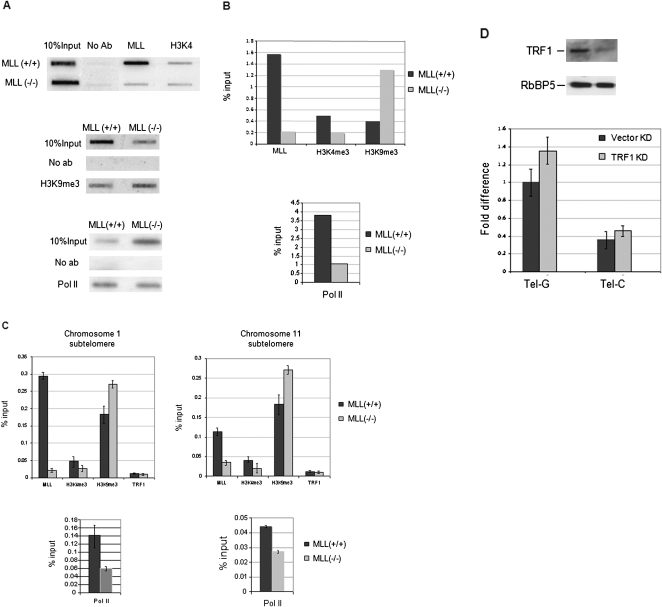
FIGURE 4.
MLL regulates chromatin equilibriums at both subtelomeres and telomeres. (A) Slot-blot analysis of ChIP DNA using indicated antibodies. The telomere specific probe was used for the hybridization. (B) Quantification of slot-blot results in A. Signals in ChIP DNA was normalized against 10% input using Image J software. (C) MLL regulates chromatin structures at subtelomere regions. ChIP experiments in Mll(+/+) and Mll(−/−) using the indicated antibodies. ChIP results are quantified using the primer sets specific for subtelomere region of chromosome 1 (left) or chromosome 11 (right). Signals are normalized as a percent input. Standard deviations are indicated by error bars. (D) Top, immunoblot was used to show the reduced levels of TRF1 in stable TRF1 knockdown cells. Immunoblot of RbBP5 protein, a component of Mll complex, was used as a loading control. Bottom, Quantitative RT-PCR for tel-sRNA in TRF1 knockdown cells.

