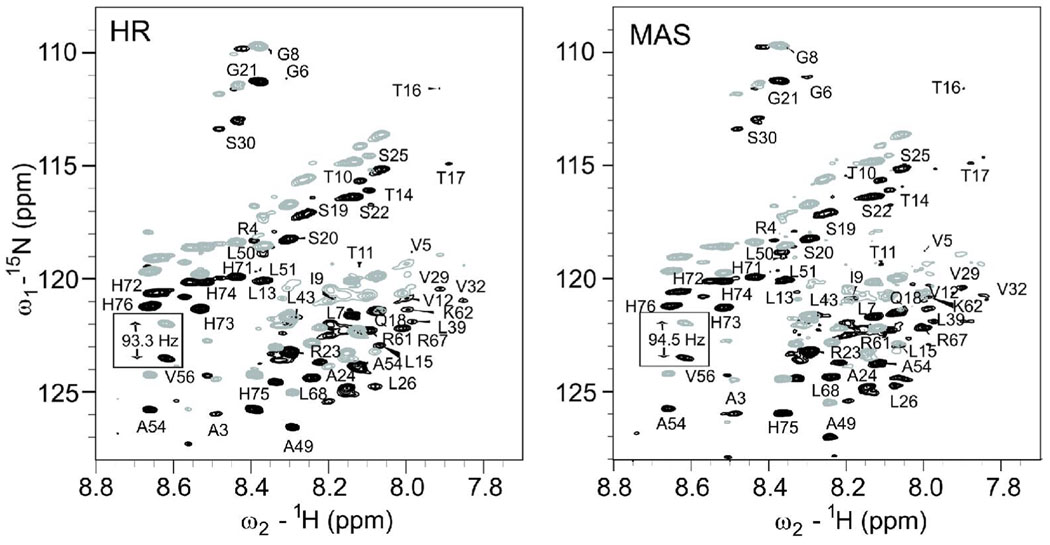
Figure 3.
Comparison of the 15N-1H IPAP spectra obtained from (A) conventional high-resolution NMR and (B) hr-MAS NMR of human glycine receptor TM23 in bicelles at q = 0.50. The gray and black peaks are the up-field and down-field IPAP peaks, respectively. The peaks for V56 are highlighted as an example to illustrate the differences in the IPAP splitting with and without MAS. The RDC values are readily measurable from these differences.

