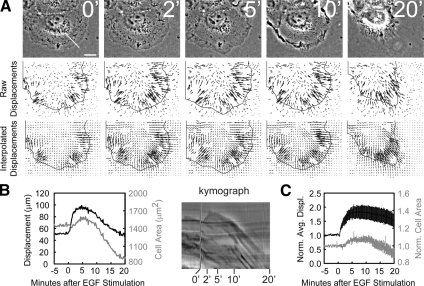
Figure 2.
EGF stimulates an increase in traction force generation during protrusion. HaCat cells imaged on fibronectin-coated 3-kPa polyacrylamide substrates containing embedded fluorescent beads. (A) Top row, phase-contrast micrographs (time after 5 nM EGF stimulation in min). Middle row, raw bead displacements (relative to their positions after trypsinization) with the cell outline overlaid. Bottom row, interpolated bead displacements, as described in Materials and Methods, with the cell outline overlaid. Bars, 10 μm. (B) Left, the cell area (gray line, right axis) and sum of the interpolated displacements within the cell area (black line, left axis) as a function of time for the cell in A. Right, a kymograph taken along the line highlighted in the 0-min image in A with time after EGF stimulation (min) below. (C) Average cell area (gray line, right axis) and average summed displacements (black line, left axis) for 11 cells, each normalized to the prestimulus values before averaging. Error bars, ±SEM; n = 11.

