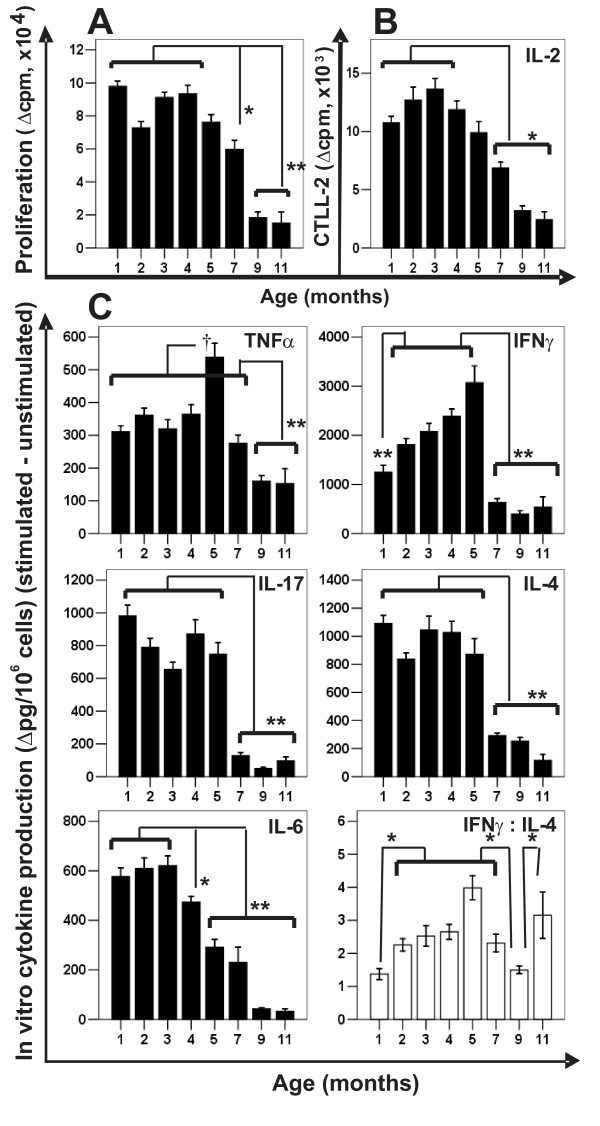
Figure 2.
PG-specific in vitro T cell responses in different age groups of PG-immunized mice. (A) PG-specific T cell proliferation (expressed as Δcpm), and (B) IL-2 production (expressed as Δcpm of CTLL-2 cells). (C)PG-induced in vitro production of TNFα, IFNγ, IL-17, IL-4 and IL-6 (Δpg cytokine/million cells). Open bars in the right-bottom corner of Panel C show the IFNγ:IL-4 ratios of the different age groups. Significantly lower (*p < 0.05 or **p < 0.01) or higher (†p < 0.05) values are indicated.

