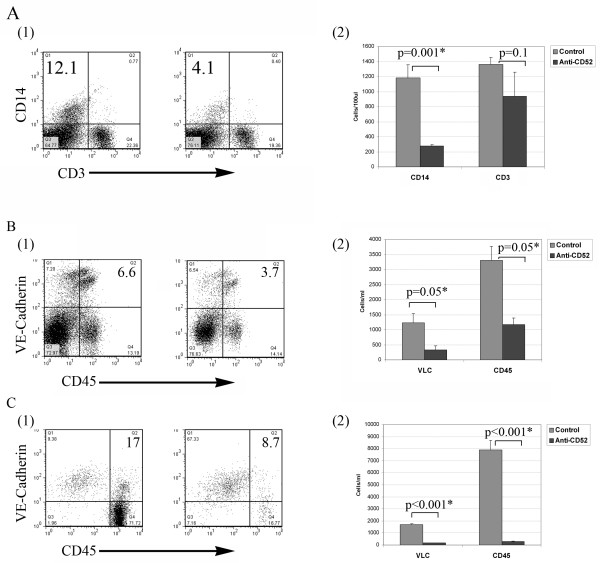
Figure 5.
Confirmation of activity of the murine anti-CD52 immunotoxin. A (1) FACS analysis of CD14+ and CD3+ cells in peripheral blood mononuclear cells isolated from control (n = 3) and anti-CD52 immunotoxin treated mice (n = 5) demonstrating a reduction in the percentage of both CD14+ and CD3+ cells in treated animals. A(2) Quantification of absolute numbers of CD14+ and CD3+ cells in peripheral blood of control and anti-CD52 treated animals. B (1 and 2) Quantification of VLC percent and absolute number in tumor associated ascites of control and anti-CD52 immunotoxin treated animals (n = 5 per group). C(1 and 2) Quantification of VLC percent and absolute number in solid tumors of control (n = 3) and anti-CD52 immunotoxin treated animals (n = 5). Tumors were harvested immediately after discontinuation of therapy.

