
Figure 2.
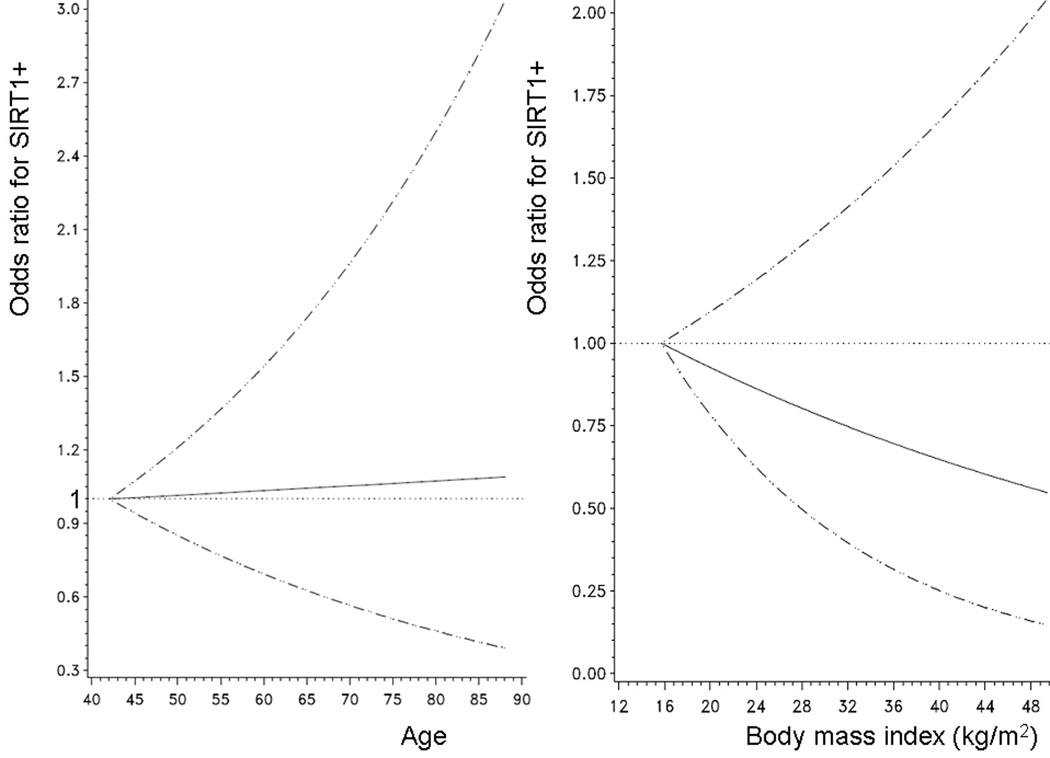
Smoothing spline plots for the relations between age and SIRT1 (left panel) and between body mass index and SIRT1 (right panel).
Unadjusted odds ratio for the association with SIRT1+ is shown as young age (left panel) or low body mass index (right panel) as a referent. 95% confidence interval is indicated by hatched lines.