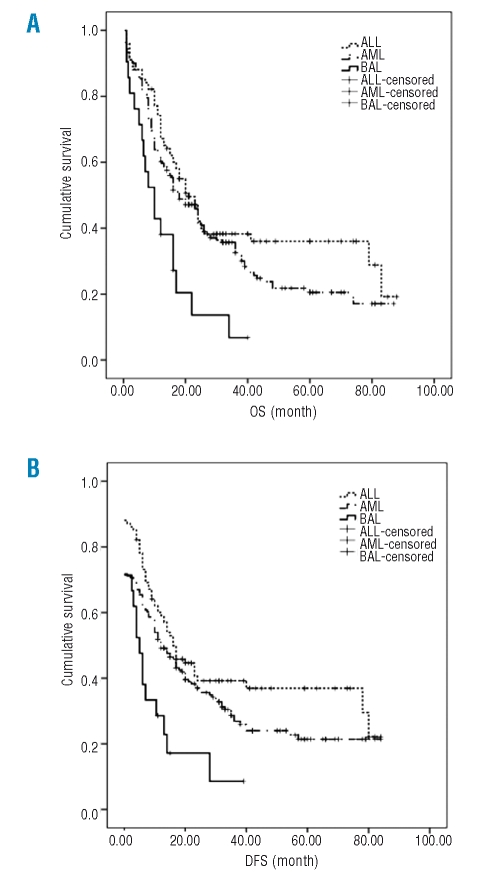
Figure 1.
(A) The overall survival of patients with BAL (solid line), AML (dashed line) and ALL (dotted line). The survival time was analyzed by Kaplan-Meier curve. (B) The disease free survival of patients with BAL, AML and ALL. The survival time was analyzed by Kaplan-Meier curve. The x-axes are the survival time and y-axes are cumulative survival.

